Reading Time: < 1 minutes
- In the early 2000s, a company called Keyhole built a computer application superimposing satellite images & aerial photos to let the users zoom in & out of a detailed view of the Earth.
- Google bought Keyhole in 2004; the same year, it bought a digital mapping startup, Where2 Technologies, and a company called ZipDash that provided real-time traffic analysis.
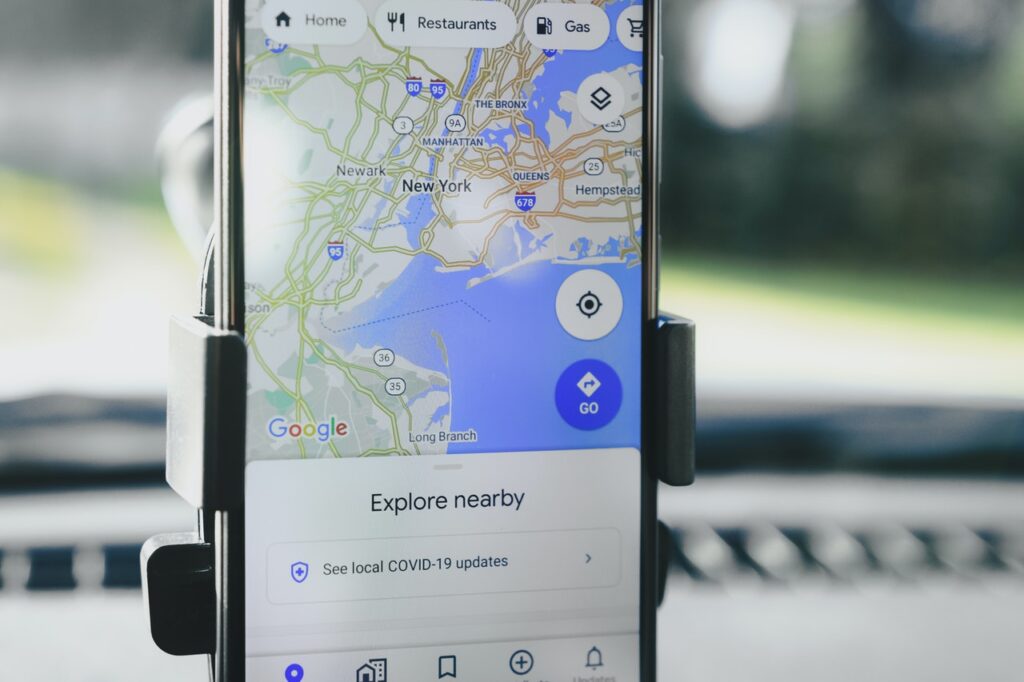
- Combining these three technologies, Google launched Google Maps in Feb 2005.
- In 2007, it added GPS (Global Positioning System) to the mix.
- GPS is a technology that uses 30+ satellites to send and receive signals to/from our phones to determine the current location.
- Now, Google is primarily a data company and so has access to reams of data collected from national and local government offices.
- The roads’ data from these government offices tell Google where every road is and how lanes are spaced, etc.
- But not all governments have data about all the roads and streets that could help Google provide an unbroken experience to the user.
- And this is where Google Street View comes into play.
- Street View is a Google program where Google collects millions of panoramic pictures using its special cars/cameras and from local contributors (here you can find where Google Car will be this month).
- Google superimposes Street View data to its existing maps data (from various sources) to verify its existing data and join any broken pieces of information.
- In a nutshell, Google Maps = Satellite phots (Keyhole) + Where2 Mapping Technology + ZipDash Traffic Analysis + GPS + Street View + Human Volunteers (they also correct errors, if any).
- Now, to use Google Maps, millions of people give Google access to their real-time location data.
- Some people have location data on, on their android devices, even when they are not using Google Maps.
- With this vast amount of data, Google uses its supercomputers to analyse traffic, road conditions, and even the speed with which people are moving.
- This is how we get live traffic information (blue = free-flowing traffic; orange = moderate traffic; red = heavy traffic).
Image courtesy of Photomix Company through Pexels
Reference shelf :

